Scan barcode

320 pages • first pub 2013 (editions)
ISBN/UID: 9781118654934
Format: Digital
Language: English
Publisher: Wiley
Publication date: 25 March 2013

Description
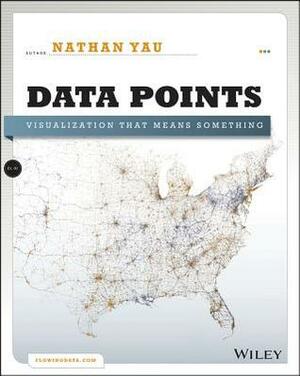
A fresh look at visualization from the author of Visualize ThisWhether it's statistical charts, geographic maps, or the snappy graphical statistics you see on your favorite news sites, the art of data graphics or visualization is fast becoming a m...
Community Reviews

Content Warnings


320 pages • first pub 2013 (editions)
ISBN/UID: 9781118654934
Format: Digital
Language: English
Publisher: Wiley
Publication date: 25 March 2013

Description
A fresh look at visualization from the author of Visualize ThisWhether it's statistical charts, geographic maps, or the snappy graphical statistics you see on your favorite news sites, the art of data graphics or visualization is fast becoming a m...
Community Reviews

Content Warnings
